
Maths: Year 6 17 Sections37 Lessons10 Weeks
3.1 Mode, median, mean and range
Mode, Median, Mean and Range
Math Year 6
Lesson Competencies
At the end of the lesson you will be able to:
Find the mode and median of sets of data.
Find the mean and range of sets of data.
Use the average and range to describe sets of data and answer questions.
Understand that averages can help you solve problems and make decisions.
Key Terms
Average
A central, typical value for a set of data. Mean, median, and mode are all types of averages.
Mean
The total of all values divided by how many values there are. Often just called “the average”.
Median
The middle value when the data is put in order from smallest to largest.
Mode
The number or item that appears the most often in a data set.
Bimodal
A set of data that has two modes (two numbers that tie for appearing the most).
Range
The difference between the highest and lowest values. It shows how spread out the data is.
Video Lesson
Core Lesson: Making Sense of Data
Introduction
Dear learners,
We are going to explore how we can understand large groups of numbers. Averages can help you solve problems and make decisions.
When people review a book out of 10, all their reviews are put together and the average number is found.
Look at these book review scores:
- The Midnight Story – Average 6 out of 10
- The Isosceles Three – Average 9 out of 10
How do you think the averages were worked out?
Let’s say 4 friends (Abebe, Sarah, Dawit, and John) reviewed The Midnight Story. Their actual scores were: 4, 8, 5, and 7. To find the mean, we add them all up (\(4+8+5+7=24\)) and divide by 4. The result is 6!
Is it possible that nobody scored The Midnight Story 6 out of 10? Yes! As you can see, the scores were 4, 8, 5, and 7. The mean is a calculated center point, even if nobody gave that exact score.
The Three Averages and The Range
1. The Mean (The Fair Share)
Add all the numbers, then divide by how many numbers there are.
Scores: 3, 5, 7, 9
\( \frac{3 + 5 + 7 + 9}{4} = \frac{24}{4} = 6 \)
Mean = 6
2. The Median (The Middle)
Put the numbers in order from smallest to largest, and find the middle one.
Scores: 12, 18, 21, 25, 30
Median = 21
If there are two middle numbers, find halfway between them!
3. The Mode (Most Popular)
The number that appears the most times. Data can be bimodal (2 modes) or have no mode.
Shoes sold: 6, 7, 8, 8, 8, 9, 10
Mode = 8
4. The Range (The Spread)
Not an average! It tells us how spread out the data is. Highest value minus lowest value.
Temps in Addis Ababa: 15°C to 24°C
\( 24 – 15 = 9 \)
Range = 9°C
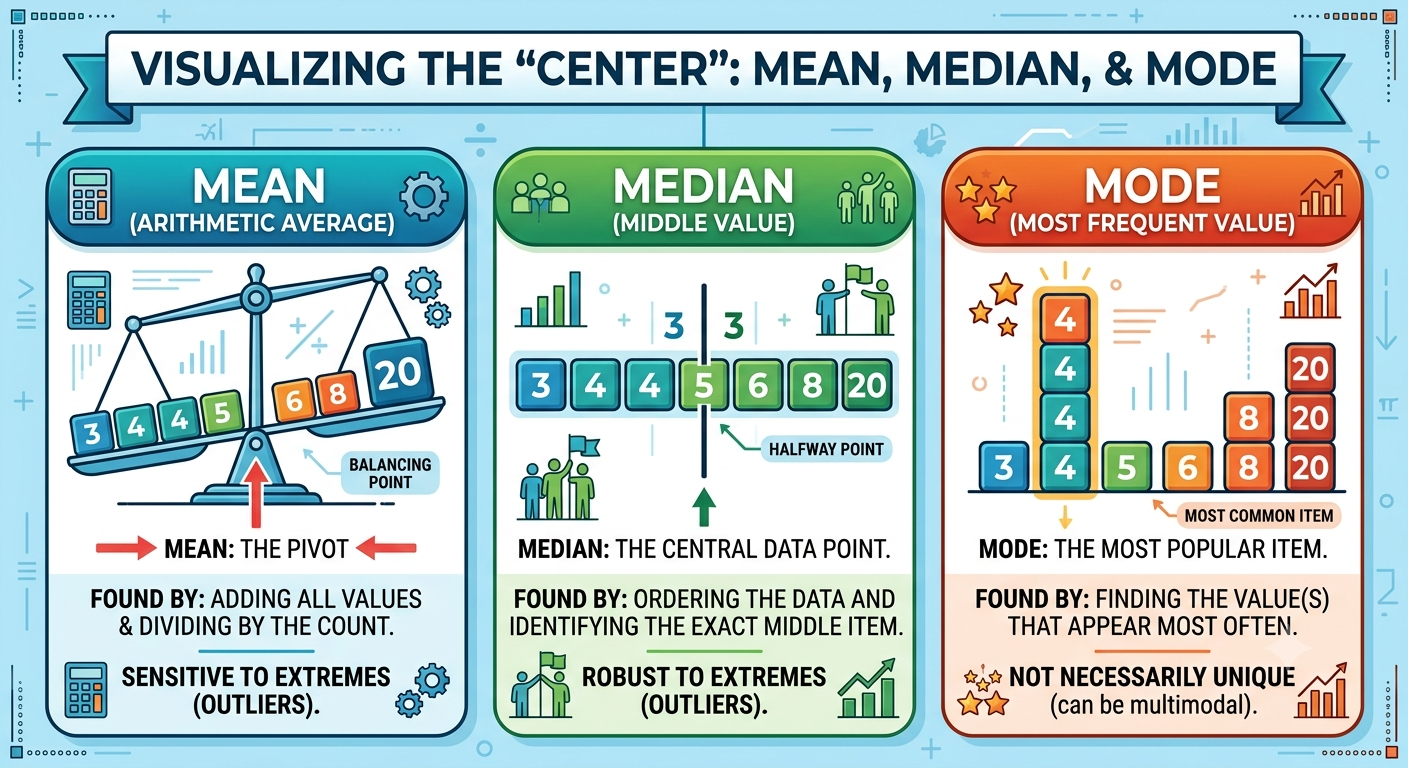
How to play: Tap a number below to select it, then tap an empty box to place it in order from smallest to largest to reveal the median.
Numbers to Sort:
Place in Ascending Order:
Activity 1: Quick Quiz
Activity 2: Tap & Match
Activity 3: Mixed Challenge
Lesson Summary
Mean: Add all values, divide by the total number of values.
Median: The middle value when data is ordered from smallest to largest.
Mode: The value that appears most often (can be bimodal).
Range: The difference between the highest and lowest values (Highest – Lowest).
An average helps summarize data into a single, helpful number.